Is higher associativity always better?
Lecture 3: Cache Memory Deep Dive Locality, Mapping, Write Policies, TLB & Prefetching
How CPU caches work: locality, set mapping, write policies, replacement, TLB, prefetching, and how to measure cache performance in practice.
Locality & AMAT
- Temporal and spatial locality keep working sets hot.
- AMAT ≈
HitTime + MissRate × MissPenalty.- Reduce any of the three to speed up memory performance.
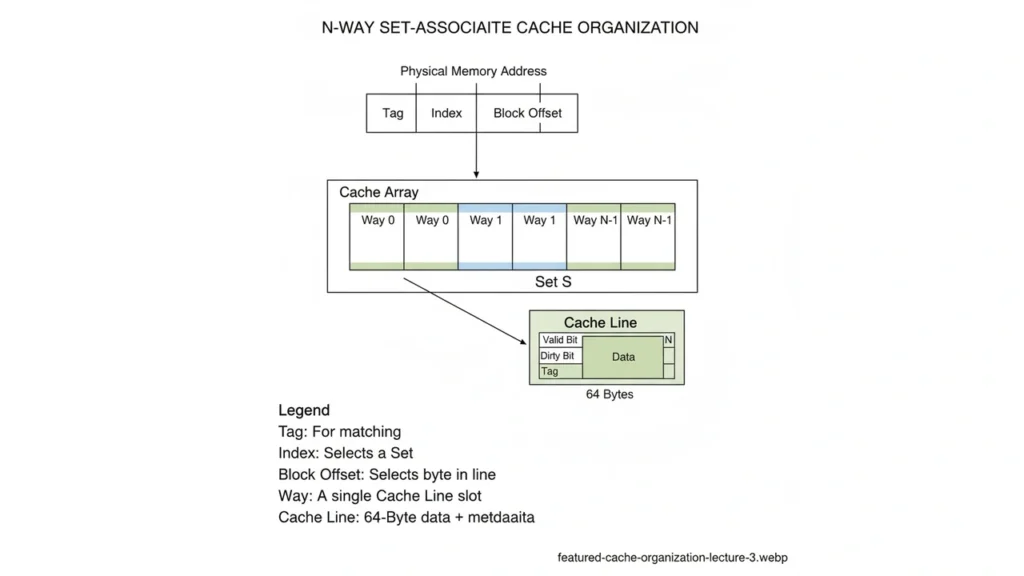
Cache Organization
- Line (block) size: commonly 64 B; too small → more misses; too large → more waste/conflicts.
- Direct-mapped: 1 line per set (fast, but conflict-prone).
- N-way set-associative: compromise; typical 4–16 ways.
- Fully associative: any line anywhere (expensive hardware).
- Index/Tag/Offset:
- Offset selects a byte within the line, Index selects the set, Tag confirms identity.
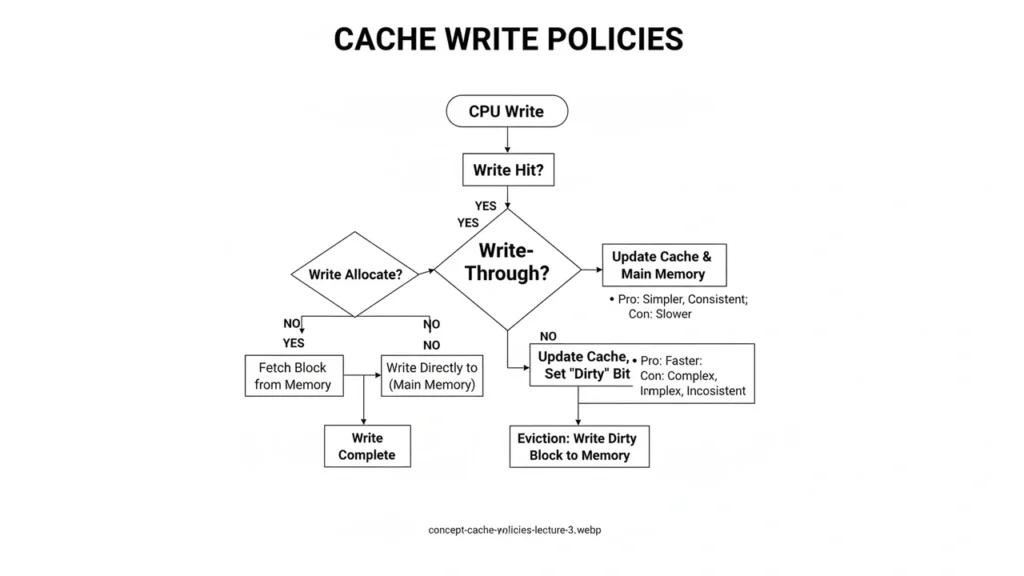
Replacement & Write Policies
- Replacement: LRU (or PLRU) tends to minimize conflict misses; random is cheap and often good enough.
- Write-through: update cache + memory immediately; simpler coherence, more bandwidth.
- Write-back: update cache only; mark dirty and write on eviction; saves bandwidth, needs dirty tracking.
- Write-allocate: on a write miss, bring the line in, then write.
- No-write-allocate: write around the cache (common with write-through).
The TLB Connection
- Each memory reference first needs virtual→physical translation.
- TLB caches recent translations; a TLB miss triggers a page table walk.
- Performance rule: good cache behavior can still be slow with TLB thrashing (e.g., huge random working sets); consider huge pages where appropriate.
Prefetching
- Sequential prefetch helps streaming reads; stride prefetch helps regular steps.
- Bad prefetch = extra traffic + pollution. Evaluate with counters/benchmarks.
Measuring Cache Behavior (Lab)
# Python/Numpy microbench (run as a script or in a notebook)
import numpy as np, time, os
N = 128*1024*1024 // 8   # 128 MB as int64
a = np.zeros(N, dtype=np.int64)

def scan(stride):
    s = 0; t = time.time()
    for i in range(0, N, stride):
        s += a[i]
    return time.time()-t, s

for stride in [1,2,4,8,16,32,64,128,256,512,1024,4096]:
    t, s = scan(stride)
    print(f"stride={stride:4d}  time={t:6.3f}s  sum={s}")
Quick Check (with answers)
- Why does larger line size improve streaming but hurt random access? More spatial locality captured, but more useless bytes fetched (pollution).
- Which policy reduces write traffic to DRAM? Write-back.
- What causes a conflict miss? Two or more hot addresses mapping to the same set/line.
- Why can TLB misses slow an otherwise cache-friendly loop? Every access still needs a translation; TLB thrash adds page walks.
- What does AMAT stand for? Average Memory Access Time.
The approach followed at E Lectures reflects both academic depth and easy-to-understand explanations.
People also ask:
Not always hardware is costlier and slower. Many designs use 8–16 ways for last-level caches.
When simplicity and data reliability are more important than raw bandwidth (e.g., small caches, MMIO regions).
They reduce TLB pressure but can increase memory waste and complicate allocation; use for large, contiguous working sets.
Grow array sizes (capacity) or change strides/alignments (conflict). If adding associativity fixes it, it was conflict-driven.
Linux perf, Intel VTune, AMD uProf, Apple Instruments, plus hardware counters via perf stat -e cache-misses,cache-references.