What is classification in Data Mining?
Lecture 5 – Classification Decision Trees, Naive Bayes, KNN & Logistic Regression
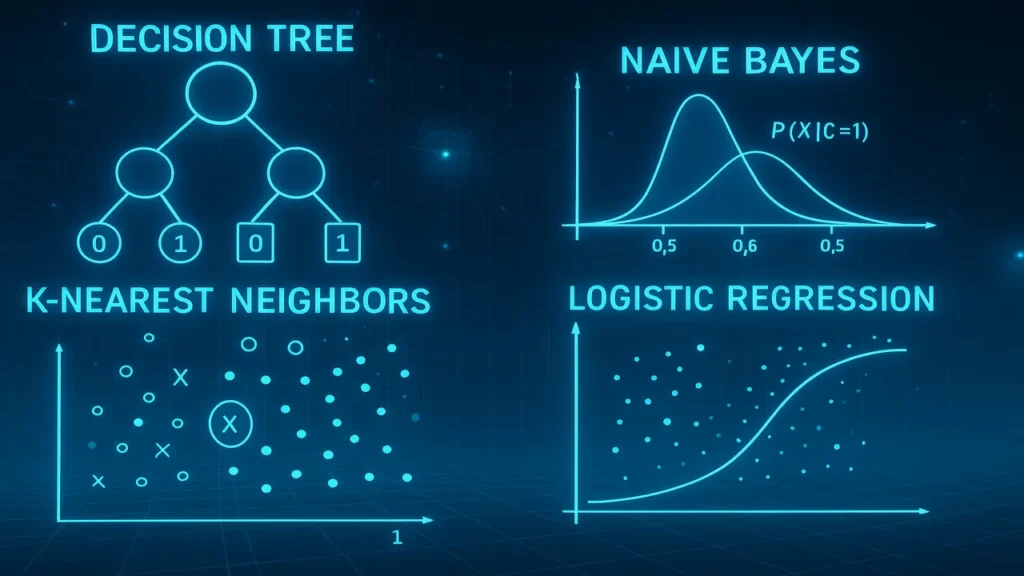
Lecture 5 covers Classification in Data Mining with detailed explanations of Decision Trees, Naive Bayes, KNN, and Logistic Regression. Includes formulas, diagrams, examples, coding, real-world applications, and comparisons.
Classification is one of the most widely used techniques in Data Mining and Machine Learning. It is a supervised learning method where the goal is to learn patterns from labeled data and use those patterns to classify new, unseen data.
From email spam filtering to disease diagnosis, classification plays a critical role in decision-making and predictive analytics.
Introduction to Classification
What Is Classification?
Classification is the task of predicting the category or class label of an input based on past labeled data.
Examples:
- Predicting whether an email is Spam or Not Spam
- Predicting if a customer will Buy or Not Buy
- Predicting whether a tumor is Benign or Malignant
Why Classification Is Important
- Helps organizations make data-driven decisions
- Automates repetitive decision tasks
- Detects patterns that humans may overlook
- Improves business intelligence and forecasting
Classification vs Prediction
| Classification | Prediction |
|---|---|
| Categories (Spam/Not Spam) | Numeric Values (Sales, Temperature) |
| Output is discrete | Output is continuous |
Real-World Uses of Classification
1. Healthcare Diagnosis
Algorithms classify whether a patient has a disease based on symptoms and medical tests.
2. Spam Detection
Email service providers classify messages using Naive Bayes and NLP techniques.
3. Fraud Detection
Banks classify whether a transaction is legitimate or fraudulent.
4. Customer Churn Prediction
Telecom companies classify whether a customer will leave the service.
Components of a Classification Model
Feature Space
Input variables used to train the model.
Target Variable
The label we want to predict.
Training vs Testing
- Training set teaches the algorithm
- Testing set evaluates performance
Decision Trees (ID3, C4.5, CART)
Decision Trees are powerful and easy-to-understand classification models.
How Decision Trees Work
The tree splits data into branches using questions like:
Is age > 30?
Is income high?
Has previous purchase history?Key Concept: Entropy
Entropy measures impurity.
Formula:
Entropy(S) = - Σ p(i) log₂ p(i)Information Gain
Measures how much entropy is reduced after a split.
Gain = Entropy(parent) – Σ (weighted entropy of child)Gini Index
Used by CART algorithm.
Gini = 1 – Σ p(i)²Example of Tree Construction
Dataset:
Age | Income | Buy?
22     High      No
45     Low       Yes
30     High      Yes
Tree:
       Income?
       /     \
   High       Low
   /           \
 No            Yes
Lecture 4 – Association Rule Mining Apriori, FP-Growth, Support, Confidence & Lift
Naive Bayes Classifier
Naive Bayes is based on probability.
Bayes Theorem
P(A|B) = [P(B|A) * P(A)] / P(B)Why “Naive”?
Because it assumes all features are independent.
Text Classification Example
Email:
"Win a free iPhone now!"Naive Bayes calculates:
- P(Spam | Words)
- P(Not Spam | Words)
Whichever probability is higher → classification.
K-Nearest Neighbors (KNN)
KNN is a simple but powerful algorithm.
How KNN Works
- Choose K
- Calculate distance between new point & all training points
- Select K closest points
- Majority class wins
Distance Metrics
- Euclidean
- Manhattan
- Minkowski
Choosing K
- Small K → Overfitting
- Large K → Underfitting
Logistic Regression
Despite its name, logistic regression is used for classification, not regression.
Sigmoid Function
Converts linear output into probability:
σ(x) = 1 / (1 + e⁻ˣ)Decision Boundary
If probability ≥ 0.5 → Class 1
Else → Class 0
Real-World Example
Predict whether a customer will purchase a product based on:
- Age
- Salary
- Browser activity
Algorithm Comparison Table
| Algorithm | Type | Strengths | Weaknesses |
|---|---|---|---|
| Decision Tree | Rule-based | Easy to understand | Overfitting |
| Naive Bayes | Probabilistic | Fast, handles text | Assumes independence |
| KNN | Distance-based | Simple, no training | Slow for large data |
| Logistic Regression | Statistical | Well-defined output | Cannot handle non-linear patterns |
Python Coding Examples
Decision Tree
from sklearn.tree import DecisionTreeClassifier
clf = DecisionTreeClassifier()
clf.fit(X_train, y_train)
Naive Bayes
from sklearn.naive_bayes import GaussianNB
model = GaussianNB()
model.fit(X_train, y_train)
KNN
from sklearn.neighbors import KNeighborsClassifier
knn = KNeighborsClassifier(n_neighbors=5)
knn.fit(X_train, y_train)
Logistic Regression
from sklearn.linear_model import LogisticRegression
log = LogisticRegression()
log.fit(X_train, y_train)
Common Issues in Classification
- Imbalanced datasets
- Multicollinearity
- Overfitting decision trees
- Choosing incorrect K value
- Poor scaling for KNN
Summary
Lecture 5 explored classification in-depth, covering decision trees, naive Bayes, KNN, and logistic regression. You learned how each algorithm works, where it is used, how to calculate entropy, information gain, probabilities, distances, and logistic functions. Real-world examples and Python code made the concepts practical and applicable.
Next. Lecture 6 Clustering – K-Means, K-Medoids, Hierarchical & DBSCAN
People also ask:
It is predicting a category based on labeled training data.
Decision Trees.
Because it assumes feature independence.
K determines how many neighbors influence classification.
Because it outputs probabilities using the sigmoid function.