What is clustering?
Lecture 6 – Clustering K-Means, K-Medoids, Hierarchical & DBSCAN
Lecture 6 explains clustering in Data Mining, including K-Means, K-Medoids, hierarchical clustering, and DBSCAN with diagrams, algorithms, examples, Python code, real-world applications, and comparisons for BS CS, BS AI, BS IT & Data Science students.
Clustering is one of the most fundamental techniques in unsupervised learning. Unlike supervised models that rely on labeled datasets, clustering finds natural groups within data without prior knowledge of categories. Whether it’s grouping customers, identifying abnormal behavior, segmenting images, or analyzing biological data, clustering algorithms are used everywhere.
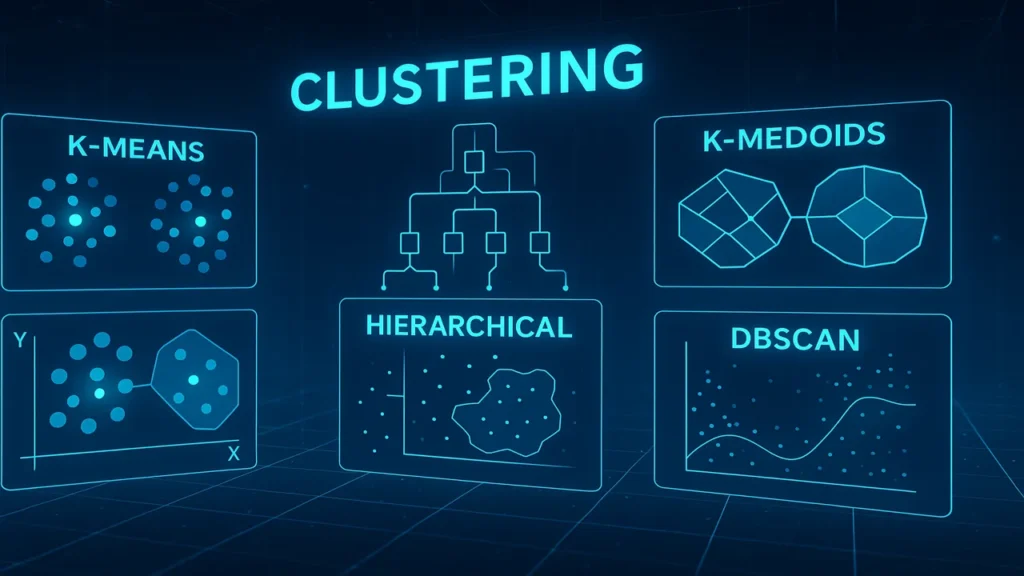
This lecture dives deep into the four most important clustering algorithms:
- K-Means
- K-Medoids
- Hierarchical Clustering
- DBSCAN
You will learn how they work, when to use them, their strengths, weaknesses, and real-world scenarios.
Introduction to Clustering
What Is Clustering?
Clustering is the process of grouping data points based on similarity.
Each group is called a cluster.
Examples:
- Grouping customers by behavior
- Grouping documents by similarity
- Grouping images by features
Why Use Clustering?
- Discover hidden structures
- Reduce data complexity
- Improve decision-making
- Preprocessing step for other algorithms
Clustering vs Classification
| Classification | Clustering |
|---|---|
| Labeled data | Unlabeled data |
| Predict categories | Discover groups |
| Supervised | Unsupervised |
| Used for known outcomes | Used for exploration |
Types of Clustering Methods
Clustering algorithms are divided into three main families.
1. Partitioning Methods
They divide data into K clusters:
- K-Means
- K-Medoids
2. Hierarchical Methods
They build a tree of clusters:
- Agglomerative
- Divisive
3. Density-Based Methods
They find clusters of arbitrary shapes:
- DBSCAN
- OPTICS
K-Means Clustering
K-Means is the most famous clustering algorithm.
How K-Means Works (Step-by-Step)
- Choose the number of clusters K
- Randomly select K centroids
- Assign each data point to the nearest centroid
- Update centroids (mean of assigned points)
- Repeat until convergence
Distance Metrics
Common metrics:
- Euclidean distance
- Manhattan distance
Euclidean formula:
d = √((x1 - x2)² + (y1 - y2)²)Choosing K (Elbow Method)
Plot:
K vs. Inertia (Within-cluster sumLook for the “elbow” the point where improvement slows.
Advantages of K-Means
Fast
Easy to understand
Works well with large datasets
Limitations
Requires K
Sensitive to outliers
Only works well with spherical clusters
Numeric Example (Simple Demonstration)
Dataset:
Points: (1,1), (2,1), (4,3), (5,4)
K = 2
Initial centroids:
C1 = (1,1)
C2 = (5,4)
Clusters form as:
Cluster A: (1,1), (2,1)
Cluster B: (4,3), (5,4)
Centroids update:
New C1 = (1.5,1)
New C2 = (4.5,3.5)
Repeat until stable.
K-Medoids (PAM Algorithm)
K-Medoids is similar to K-Means but more robust to noise.
Difference from K-Means
| K-Means | K-Medoids |
|---|---|
| Uses mean | Uses medoid (actual data point) |
| Sensitive to outliers | Robust to outliers |
PAM Algorithm Steps
- Choose K points as medoids
- Assign each data point to the nearest medoid
- Swap medoids with non-medoids to reduce cost
- Continue until no improvement
When to Use K-Medoids
- When dataset contains noise
- When outliers may distort centroids
- When you need guaranteed actual data representatives
Hierarchical Clustering
Hierarchical clustering builds a tree-like structure called a dendrogram.
Two Types
1. Agglomerative
Starts with each point as its own cluster, then merges clusters.
2. Divisive
Starts with one cluster, then splits into smaller clusters.
Dendrogram Explanation
      ┌──────────── A
   ┌──┤
   │  └──────────── B
───┤
   │   ┌────────── C
   └───┤
       └────────── D
Cutting the dendrogram at different heights gives different numbers of clusters.
DBSCAN (Density-Based Clustering)
DBSCAN is powerful for discovering clusters of any shape.
Key Concepts
- Core Point: Enough neighbors
- Border Point: Near a core
- Noise Point: Irregular/outlier
How DBSCAN Works
- Choose parameters:
- ε (epsilon) → distance
- minPts → minimum neighbors
- Find core points
- Form clusters around them
- Mark remaining points as noise
Advantages of DBSCAN
Finds arbitrarily shaped clusters
Handles noise
No need to specify K
Limitations
Difficult to choose ε
Struggles with varying density
Comparison Table of Clustering Algorithms
| Algorithm | Needs K? | Handles Noise | Cluster Shape | Speed |
|---|---|---|---|---|
| K-Means | Yes | Poor | Spherical | Fast |
| K-Medoids | Yes | Good | Spherical | Medium |
| Hierarchical | No | Medium | Tree structure | Slow |
| DBSCAN | No | Excellent | Arbitrary | Medium |
Practical Case Studies
1. Customer Segmentation
K-Means is commonly used to group customers based on:
- Spending habits
- Demographics
- Browsing behavior
2. Image Segmentation
Hierarchical clustering groups similar pixels.
3. Fraud Detection
DBSCAN identifies abnormal transactions as noise.
Python Code Examples
K-Means
from sklearn.cluster import KMeans

kmeans = KMeans(n_clusters=3)
kmeans.fit(X)
labels = kmeans.labels_
K-Medoids
from sklearn_extra.cluster import KMedoids

model = KMedoids(n_clusters=3)
model.fit(X)
Hierarchical
from sklearn.cluster import AgglomerativeClustering

hier = AgglomerativeClustering(n_clusters=3)
hier.fit(X)
DBSCAN
from sklearn.cluster import DBSCAN

db = DBSCAN(eps=0.5, min_samples=5)
db.fit(X)
Common Mistakes in Clustering
- Using K-Means without scaling data
- Choosing wrong K
- Using K-Means for non-spherical clusters
- Misinterpreting dendrograms
- Incorrect DBSCAN parameter selection
Summary
Lecture 6 covered four primary clustering methods used in Data Mining: K-Means, K-Medoids, Hierarchical Clustering, and DBSCAN. You learned how each algorithm works, the mathematics behind them, their real-world applications, strengths, limitations, and Python implementations. These clustering techniques form the backbone of unsupervised learning.
People also ask:
Clustering groups similar data points together without labels.
No single algorithm is best depends on dataset structure.
Because it is simple, fast, and works well with large datasets.
When clusters have irregular shapes or dataset contains noise.
A tree-like diagram used in hierarchical clustering.