What is a data warehouse?
Lecture 12 – Data Warehousing and OLAP for Data Mining
Lecture 12 explains Data Warehousing & OLAP for Data Mining, covering architecture, ETL processes, star/snowflake schema, multidimensional models, OLAP operations, cubes, case studies, and real-world applications.
Data Mining is only effective when the underlying data is integrated, clean, consistent, and well-organized. In enterprise environments, data comes from dozens of systems billing, CRM, ERP, social media, apps, IoT sensors, and external sources.
To analyze this information efficiently, organizations use data warehouses and OLAP systems.
This lecture provides a deep understanding of:
- Data warehouse architectures
- ETL pipelines
- Multidimensional cubes
- OLAP operations
- Schema design
- Industry use-cases
It prepares students to handle real-world analytical systems used by banks, hospitals, retail giants, governments, and tech companies.
Introduction to Data Warehousing
Why Data Warehouses Exist
Operational databases (OLTP) are designed for transactions, not analytics.
Example OLTP tasks:
- Insert new orders
- Update stocks
- Process payments
But they cannot efficiently handle:
- Trend analysis
- Sales comparisons
- Seasonal behavior
- Multi-year predictions
That’s why Data Warehouses are built.
Differences Between OLTP & OLAP
| Feature | OLTP | OLAP |
|---|---|---|
| Purpose | Daily operations | Analysis & Decision Making |
| Queries | Simple, short | Complex, long |
| Speed | High | Medium |
| Data Type | Current | Historical |
| Users | Clerks, Cashiers | Analysts, Managers |
| Example | ATM system | Business analytics dashboard |
Data Warehouse Architecture
Single-Tier Architecture
Goal: Minimize redundancy by storing everything in one place.
Not commonly used.
Two-Tier Architecture
Client ↔ Server
Used for small-scale warehouses.
Three-Tier Architecture (Most Common)
Tiers:
- Bottom Tier (Data Warehouse Server)
- Stores integrated warehouse data
- Middle Tier (OLAP Server)
- MOLAP
- ROLAP
- HOLAP
- Top Tier (Front-End Tools)
- Dashboards
- Analytics
- Reports
Components of a Data Warehouse
Data Sources
Examples:
- ERP systems
- CRM
- Web logs
- IoT sensors
- Social media
ETL (Extract, Transform, Load)
Extract
Pull data from source systems.
Transform
Clean, standardize, convert, merge.
Load
Insert into warehouse.
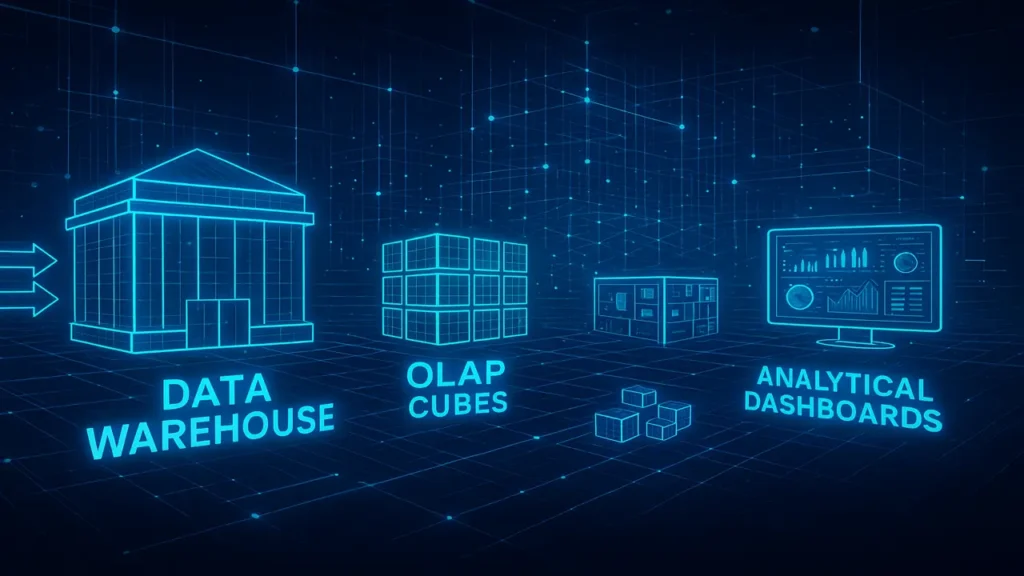
Text-based ETL Diagram
Source → Extract → Transform → Load → Warehouse → OLAP → ReportsStaging Area
Temporary storage for transformation before loading.
Metadata Repository
Stores:
- Data descriptions
- Business rules
- Table mappings
Data Marts
Small, department-specific warehouses.
Examples:
- Marketing mart
- Finance mart
- Sales mart
Lecture 11 – Ethical Legal and Privacy Issues in Data Mining
Multidimensional Data Model
A warehouse organizes data using cubes.
Cubes
A cube is a multidimensional dataset used for analysis.
Example Cube Dimensions:
- Time
- Product
- Region
Dimensions
Attributes used for analysis.
Example:
Time → Year, Quarter, Month, Day
Product → Category, Brand, Item
Region → Country, State, City
Measures
Numerical data for analysis:
- Total sales
- Profit
- Quantity
Fact Table & Dimension Table
Fact Table:
- Contains measures
- Example:
sales_amount,units_sold
Dimension Tables:
- Describe business entities
- Example:
dim_product,dim_customer
Star Schema vs Snowflake Schema
Star Schema
- Central fact table
- Surrounding dimension tables
- Simple and fast
Diagram:
         dim_customer
               |
dim_time — fact_sales — dim_product
               |
         dim_region
Snowflake Schema
Dimensions broken into sub-dimensions.
Example:
dim_location → country → state → cityMore normalized but slower.
OLAP: Online Analytical Processing
OLAP allows fast analysis using cubes.
MOLAP
- Multi-dimensional OLAP
- Data stored in optimized cube format
- Fastest queries
ROLAP
- Relational OLAP
- Uses relational DB tables
- Scalable but slower
HOLAP
- Hybrid OLAP
- Combines MOLAP + ROLAP
OLAP Operations
Roll-Up (Aggregation)
Going from detailed data → summarized data.
Example:
Day → Month → Year
City → Country
Drill-Down (Reverse of Roll-Up)
Going from summarized → detailed.
Example:
Year → Quarter → Month → DaySlice
Selecting a single dimension.
Example:
Only 2023 dataDice
Selecting multiple dimensions.
Example:
2022 & 2023 + Product A + Region AsiaPivot
Rotating cube view to see data from a new angle.
Warehouse Design Process
Requirements Collection
Meet stakeholders to define analytical needs.
Dimensional Modeling
Design fact & dimension tables.
Building Cubes
Define:
- Measures
- Dimensions
- Aggregations
Case Studies
Retail Industry (Walmart, Amazon)
Used for:
- Product demand forecasts
- Store performance
- Customer segmentation
- Basket analysis
Banking
Used for:
- Fraud detection
- Customer insights
- Credit scoring
Healthcare
Used for:
- Patient analytics
- Disease surveillance
- Hospital workflow optimization
How Warehousing Supports Data Mining
Improved Data Quality
Cleaning + integration ensures high-quality data.
Efficient Query Processing
Cubes enable fast aggregations.
Clean & Integrated Data
Data mining models perform better.
Summary
Lecture 12 explained the foundation of Data Warehousing & OLAP for Data Mining. Students learned about architectures, ETL, dimensional modeling, star/snowflake schema, cubes, OLAP operations, and industry use cases. This prepares learners to handle large-scale analytical environments and supports future advanced mining projects.
People also ask:
A centralized storage system for analytical data.
Fast multi-dimensional analysis.
Star = simple, denormalized.
Snowflake = normalized, complex.
To extract, clean, and load data into the warehouse.
For fast multidimensional queries.